Working with the Graphus dashboards
This article describes the partner and organization dashboards and they value they provide when analyzing alerts.
The Graphus dashboards
The Graphus threat dashboards are the perfect place to get an overview of the different attacks your organization or customers are facing. Graphus offers two dashboards. The partner dashboard provides an overview of the most important KPIs for all of your organizations. The organization dashboard is your central place to get a closer look at the attacks Graphus blocked and the user interactions for one particular domain.
Before we describe the dashboards in more detail, let's quickly review the four layers of protection for which Graphus creates alerts.
- Automated Quarantine: When Graphus determines an email to be malicious, it removes the email from the user’s inbox.
- EmployeeShield warning banners: For emails that Graphus determines are not malicious but may be suspicious, a warning banner is placed at the top of the email. The banner can be interactive to allow a recipient to provide feedback to the AI indicating if a sender is trusted or not.
- Phish911 email reporting: For emails that users identify as suspicious but weren’t quarantined or bannered by Graphus, the Phish911 component enables users to report these emails immediately. Graphus will automatically quarantine the message for all recipients who were part of the email. Then, Graphus will notify the IT admin who will investigate the message. If the admin determines the email is safe, they will unquarantine the email.
- Personal Mail filter: The Personal Filter provides individual mail filtering functionality to each email recipient. When a recipient determines that an email is unwanted and should be blocked, the recipient can mark the email as junk by clicking Block as Junk in the EmployeeShield banner. Future emails from this sender that are intended for the recipient will be blocked.
Partner dashboard
The partner dashboard displays a quick overview of what is happening in your email domains (organizations) that Graphus protects. It provides a summary of the most important KPIs for all of your organizations and is accessed via the Insights item on the top menu.
- Attacks Quarantined: Conveys the number of quarantined attacks.
- Unsafe Deleted: Shows the number of emails with a warning banner that were deleted by recipients.
- Phish911 Reports: Indicates the number of Phish911 reports submitted by recipients. These need to be reviewed by an admin or analyst.
- Inboxes: Indicates the number of inboxes that are protected by Graphus.
- Blocked Emails: Shows the number of emails blocked by the personal mail filters and the organization spam filter.
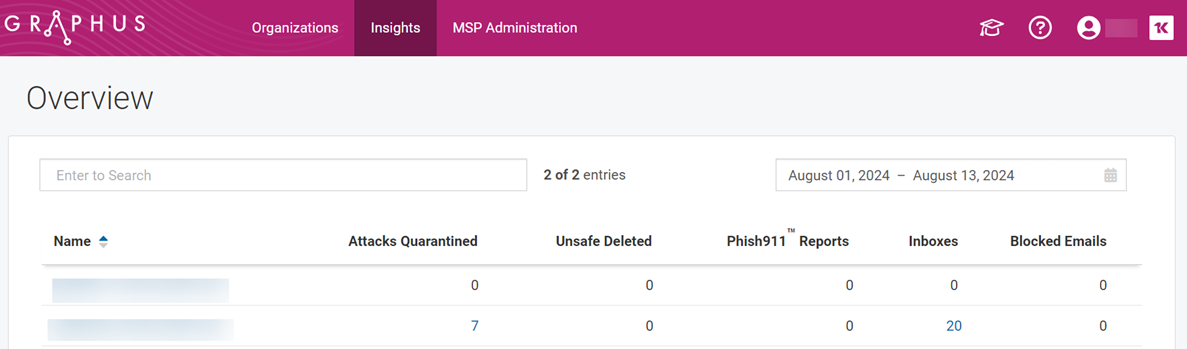
You can use the Date Range drop-down list to select a specific investigation time frame on which the displayed information will be based. You can also use the search bar to narrow down the amount of organizations you see. If you click on any number (except zero), the partner dashboard will take you to a detailed view for this particular organization. For Attacks Quarantined you will be forwarded to the Quarantine alert table for this organization and see all alerts created in the date range you defined prior in the partner dashboard.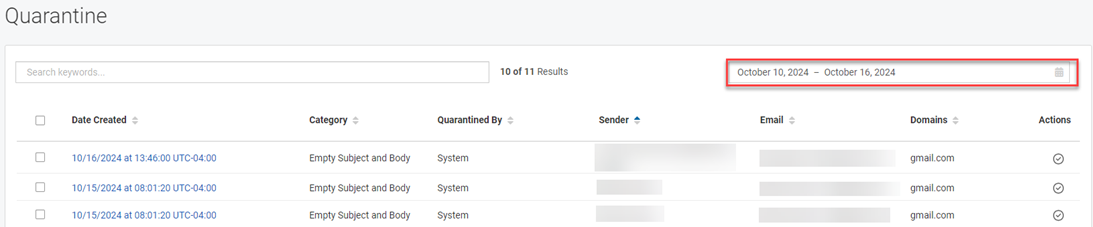
Organization dashboard
The organization dashboard provides a summary of alert information for the organization you select. It is a great resource for monitoring the status of the organization's Quarantine, EmployeeShield, and Phish911 alerts and to start looking for any anomalies.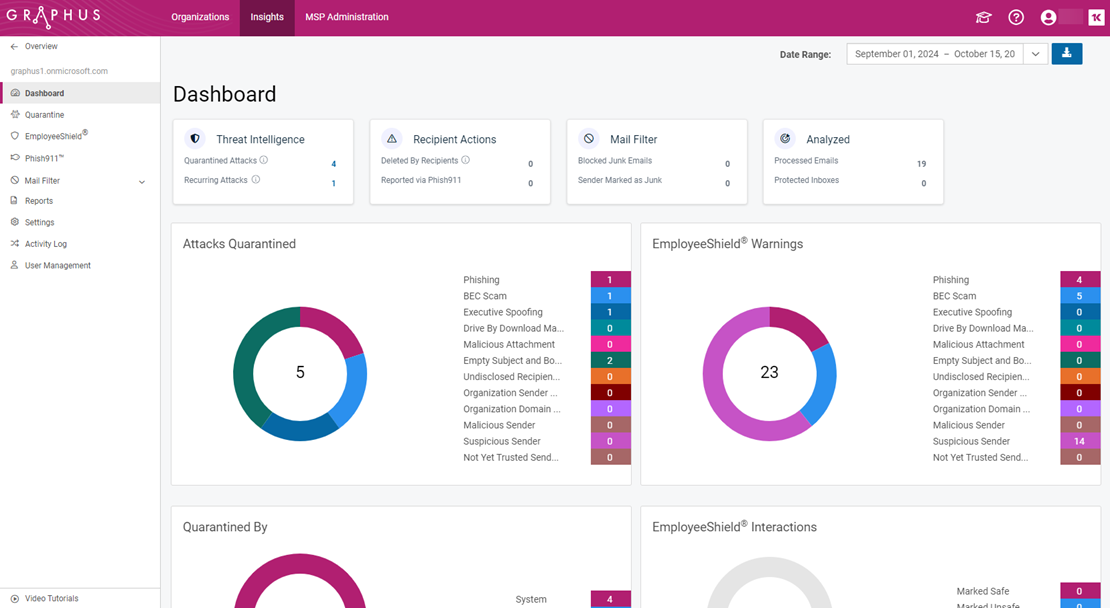
The organization dashboard is accessed by clicking an organization name on the partner dashboard or on the Organizations page.
You can use the Date Range drop-down list to select the specific time frame on which the displayed information is based.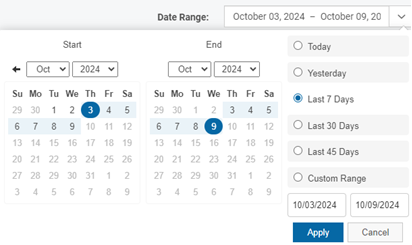
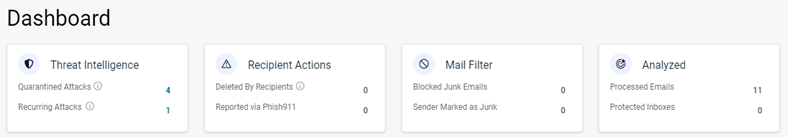
The four cards displayed at the top of the Dashboard are described below:
- Threat Intelligence: Quarantined Attacks shows the number of phishing emails quarantined by Graphus or the admin. Recurring Attacks conveys the number of phishing emails that were sent by one sender or domain to multiple recipients or to the same recipient multiple times.
- Recipient Actions: Deleted by Recipients is the number of emails with an EmployeeShield banner that were deleted by recipients. The number of suspicious emails reported by recipients using the Phish911 component is indicated by the Reported via Phish911 value.
- Mail Filter: This card displays Personal Spam Filter statistics. Blocked Junk Emails shows the number of emails blocked by the system. The Sender Marked as Junk value indicates the number of senders who are actively blocked by the Personal Filter.
- Analyzed: The Analyzed card conveys the number of emails processed for the date range selected and the number of currently protected inboxes.
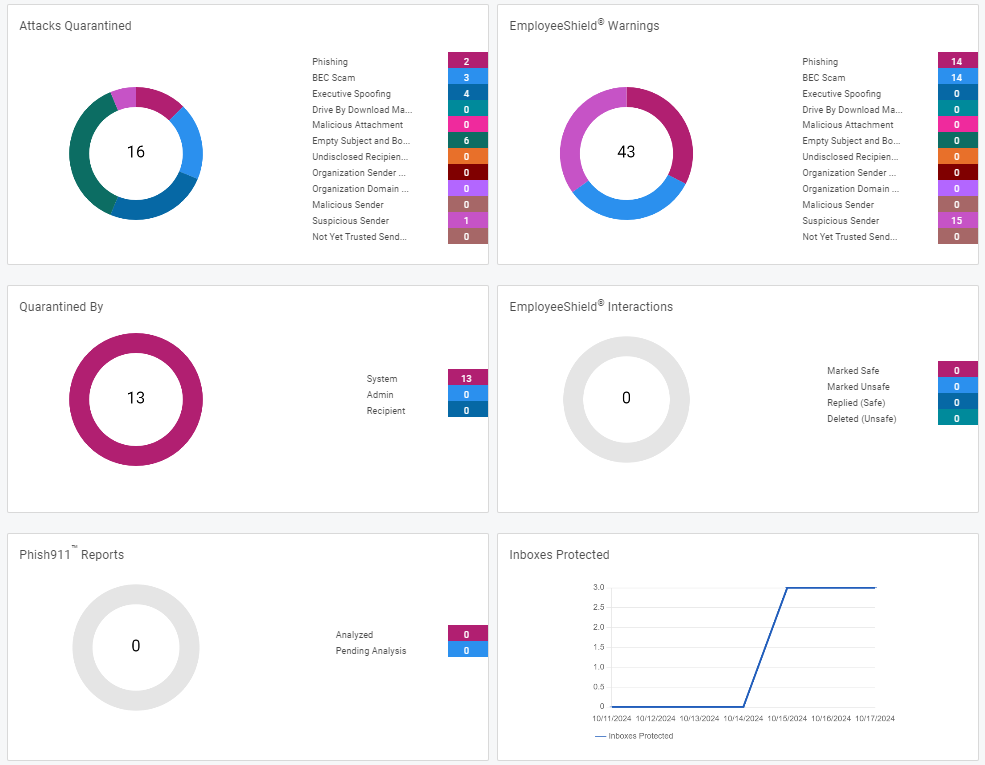
Main cards
Information for each of the email protection methods is broken down in their respective cards.
For example, the Attacks Quarantined card shows the number of attacks that were quarantined in each threat category. 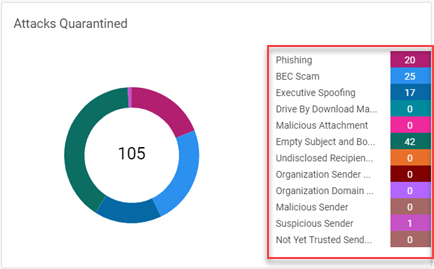
When you click any non-zero number in the category column, the system will navigate to the applicable alert table and filter the results based on the selected category. In this example, in the Attacks Quarantined card, the BEC Scam number (25) is clicked.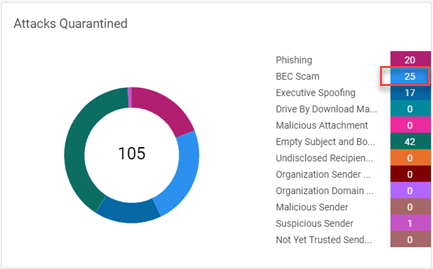
Graphus navigates to the Quarantine alert table which lists the 25 BEC scam emails that were quarantined. From here, you can investigate an alert by clicking a link in the Date Created column.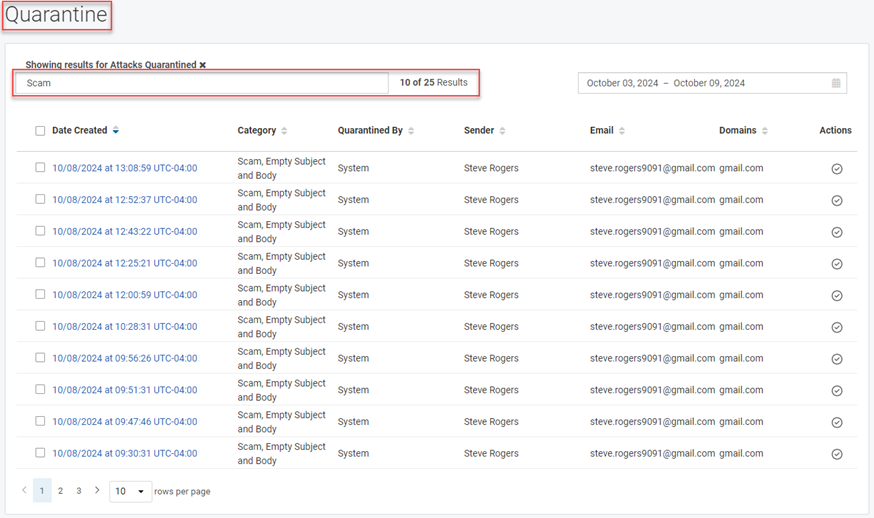
NOTE When Graphus takes action related to the Quarantine, EmployeeShield, and Phish911 protection methods, it creates an alert in the alert table for the applicable protection method. The alert tables for each are described in the protection method analyzing guides.
Each card includes a donut chart corresponding to the category column data. You can hover over a color bar in the chart to display the item's percentage of the total.
In this example, 20 phishing emails were quarantined. This is 19% of the total number of attacks (105) that were quarantined.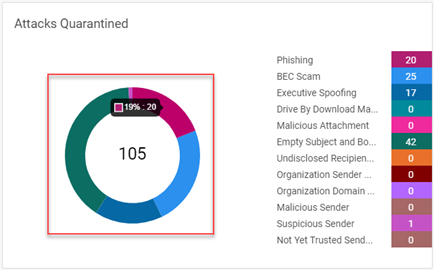
Card descriptions
A description of each card is below. Remember that the data in each card is based on the Date Range selected.
- Attacks Quarantined: Conveys the total number of category emails quarantined as well as the number quarantined for each category. One attack can apply to more than one category, increasing the total number indicated in the donut chart. Therefore, the chart number may be greater than the number shown in the Threat Intelligence card and in the chart displayed in the Quarantined By card.
- Quarantined By: Shows the total number of phishing emails quarantined and the number quarantined by the System, Admin, and Recipient via the banner.
- Phish911 Reports: Indicates the total number of Phish911 reports submitted and those that have been Analyzed and those that are waiting (Pending) to be analyzed.
- EmployeeShield Warnings: Conveys the total number of category emails in which Graphus inserted a warning banner as well as the number of warning banners inserted for each category. The same email can apply to more than one category, increasing the total number indicated in the donut chart.
- EmployeeShield Interactions: Shows the total number of EmployeeShield Interactions and the number of actions taken on the banner or emails with a banner. Marked Safe and Marked Unsafe are emails with a banner where a recipient marked the sender as safe or unsafe. Replied (Safe) and Deleted (Unsafe) shows you if a recipient replied to or deleted an email with a warning banner.
- Inboxes Protected: Indicates the number of inboxes that are protected by Graphus each day.