Analyzing alerts
This guide provides step-by-step instructions for analyzing Quarantine and EmployeeShield alerts as well as Phish911 reports utilizing the Graphus investigate dialog box.
Investigate dialog box
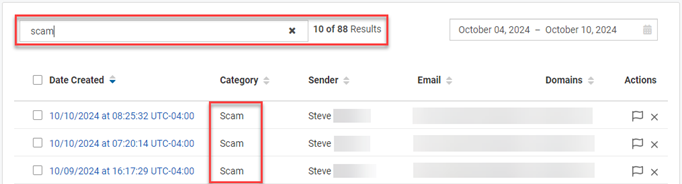
When Graphus takes action related to one of the protection methods, it creates an alert in the applicable alert table. This is an example of the Quarantine alert table. 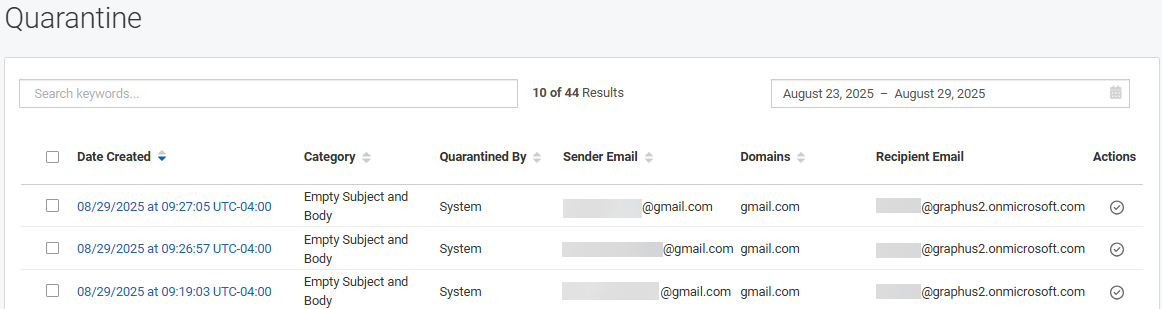
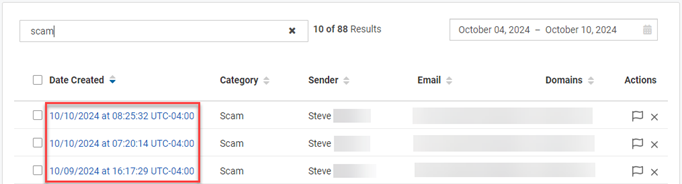
The Investigate dialog box is displayed when clicking the Date Created link in one of the alert tables. The dialog box provides you with a variety of tools for investigating Quarantine, EmployeeShield, and Phish911 alerts. 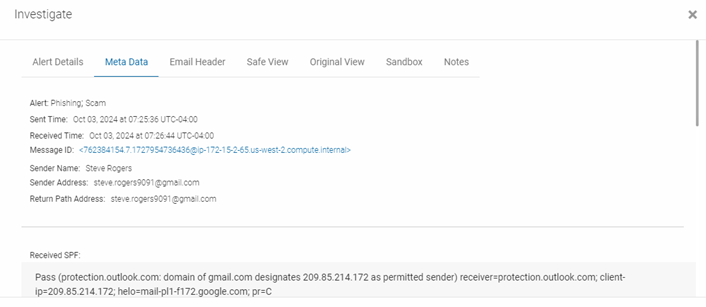
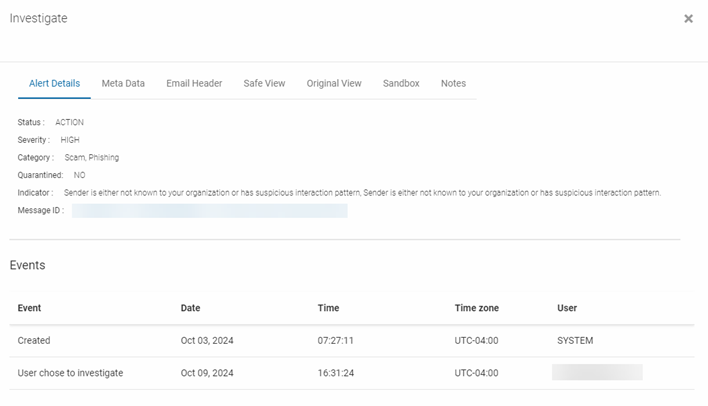
Alert Details
The Alert Details tab is a good place to start your investigation as it summarizes the alert and indicates the reason Graphus created the alert.
NOTE The Phish911 alert table does not include the Alert Details tab.
The key fields are the following:
- Category: Indicates the attack category as determined by Graphus.
- Indicator: Provides the reason Graphus took action on this specific email.
- Quarantined: Shows if the email is still quarantined.
Events table
The Events table tracks the date and time alert-related events occurred. Events include the following:
- User chose to reply
- Opened by user
- Quarantined by admin
- Admin reported false+ve (false positive)
- Automatically quarantined by system
- Quarantined by user
- User chose to investigate
- Un-Quarantined by admin
- Automatically closed by system
- Created
- User reported false+ve (false positive)
- Closed
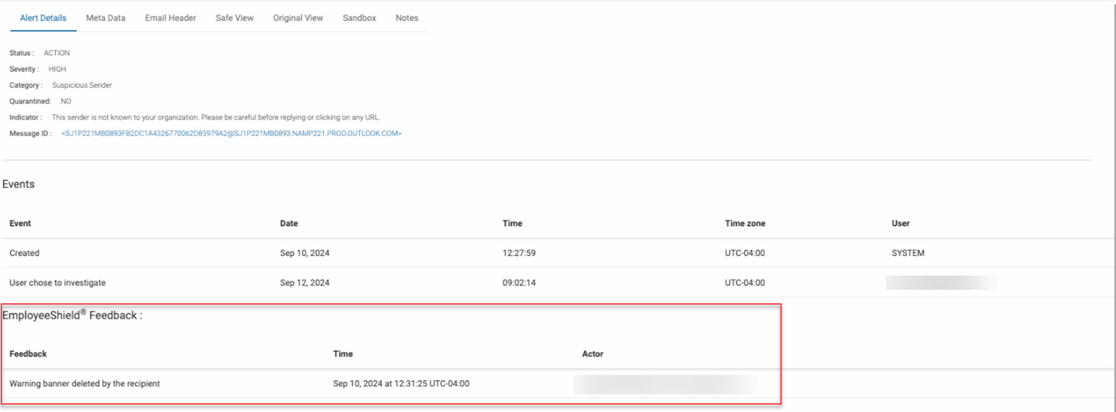
EmployeeShield Feedback table
The feedback table appears in the EmployeeShield alert table and provides information regarding actions taken on the banner by the recipient.
The possible actions that will appear in the Feedback column:
- Warning banner read by the recipient
- Original message viewed
- Original message deleted
- Warning banner deleted by the recipient
- Warning banner archived by the recipient
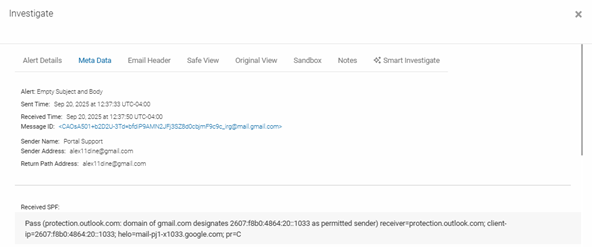
MetaData
The MetaData tab displays important data about the email itself. This includes sender data such as the Sender Name, Sender Email Address and Return Path Address.
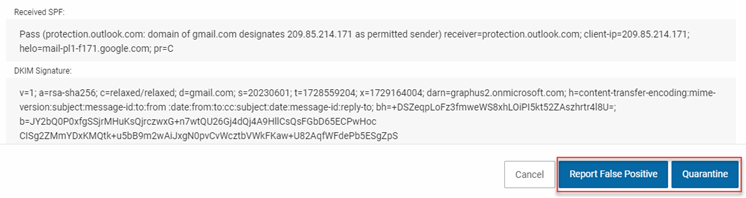
In the Authentication Results section, you can see whether the email passed or failed the authentication protocol. Failing authentication is a strong indication that the email may have been spoofed.
The sender's country of origin and the IP address of the server's Mail Transfer Agent (MTA) are conveyed in the Sender MTA section.
The Recipient's section shows the list of email recipients, any URLs or attachments the email contains, and the current folder in which the email is located.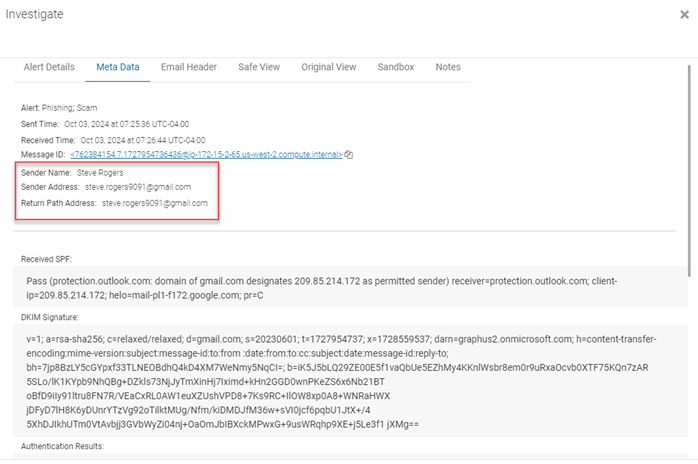
Email Header
Detailed metadata information can be found on the Email Header tab via an API call into the recipient's inbox. This includes specific details about the path the email took to arrive.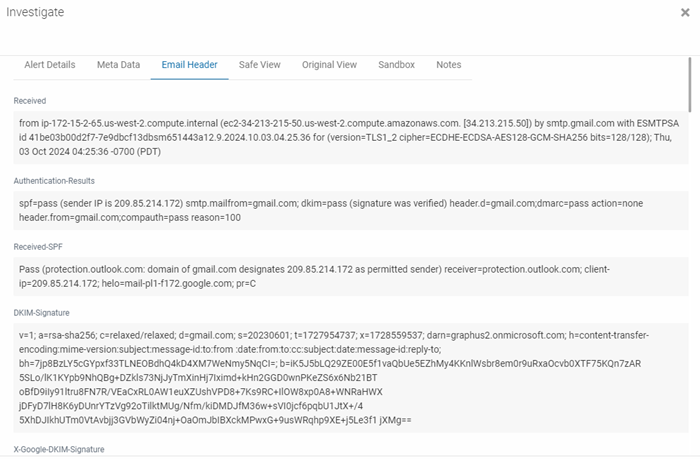
Safe View
The text-only version of the actual email is displayed on the Safe View tab via an API call into the recipient's inbox.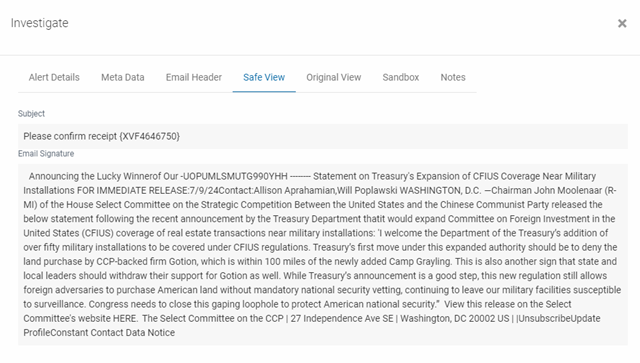
Original View
The Original View tab shows the email the same way the recipient would see it, meaning with images, formatting, links, etc. This is done via an API call into the recipient's inbox.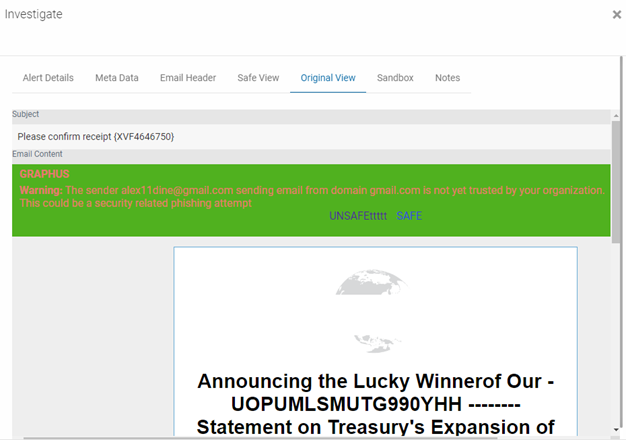
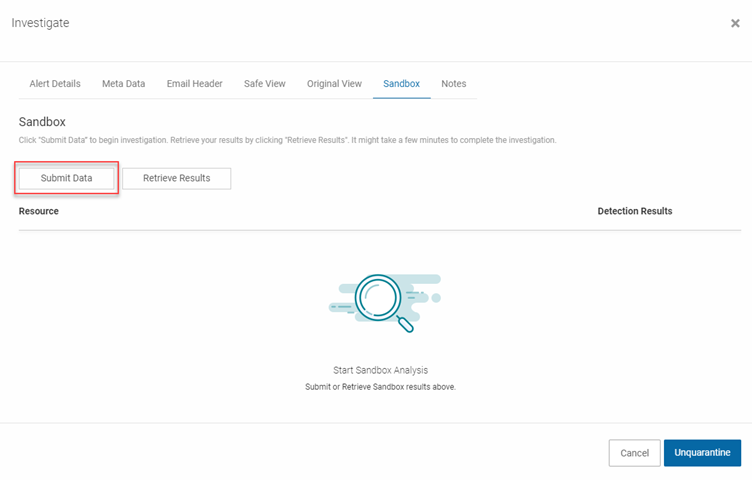
Sandbox
On the Sandbox tab, you can submit the URLs or attachments from the email to a network of well-known anti-virus providers. Graphus will never submit your original files. It only submits hashes of your files. If the file comes back as unknown or unrated, you can submit the file manually outside of Graphus to a provider of your choice.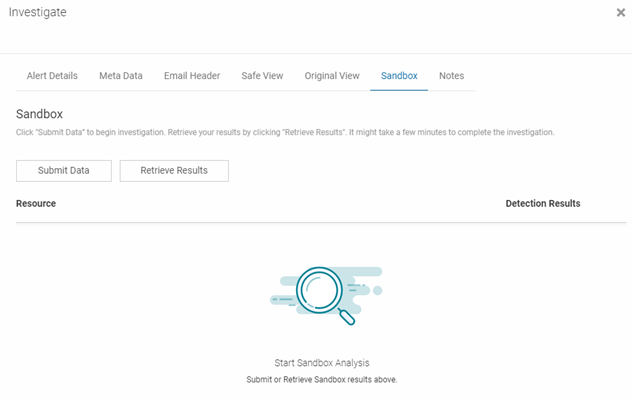
NOTE The Sandbox tab will only be visible in the dialog box if the email includes a URL or attachment. The processing of a URL or attachment might take a few minutes. If you don't see any results after clicking the Retrieve Results button, wait and try it again a little bit later.
Notes
Any comments entered are displayed on this tab. You can enter your own comments notes regarding your investigation in the Notes field and then click Add Comment.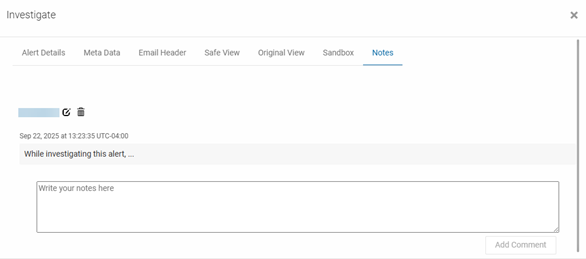
Smart Investigate
Some analysts may not be familiar with all the details in an alert during an investigation. As a result, they may perform additional research using online tools but are not always equipped to frame questions in a way that returns clear and useful information. Smart Investigate provides an AI-driven interface with preloaded, one-click questions. Based on the attack category determined by Graphus and the reason Graphus quarantined the email, Smart Investigate automatically curates relevant queries and includes alert-specific metadata to deliver clear, actionable feedback.
IMPORTANT The Smart Investigate feature is available only when investigating system-quarantined alerts on the Quarantine page.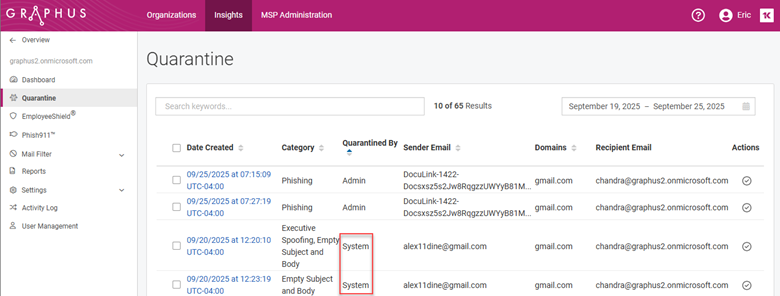
Smart Investigate tab
The Smart Investigate tab lists the threat category name and the relevant questions in the left pane. Clicking a question displays key alert information in the right pane. This example shows the contents of the Smart Investigate tab for an Executive Spoofing threat. The second question is selected, displaying its specific answers.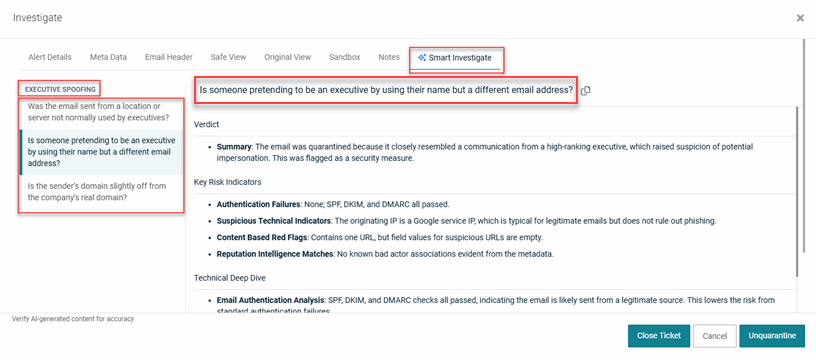
Key considerations
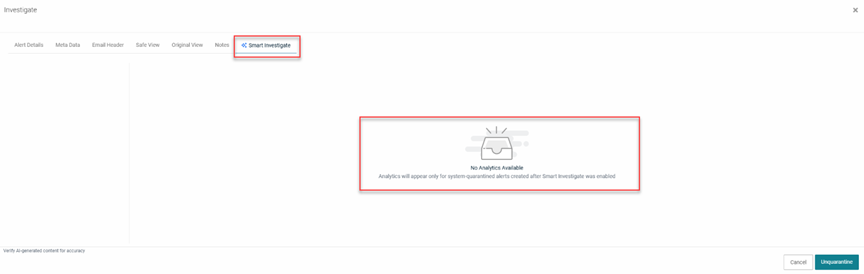
- Information appears on the Smart Investigate tab for system-quarantined alerts generated only after the feature was enabled.
- For older alerts or alerts without available questions and feedback, the tab indicates that no analytics are available.
- While the sections and criteria remain consistent across attack categories and questions, the displayed information is tailored for each specific alert.
- If Graphus determines that more than one attack category applies to the email, each category and its associated questions is listed in the left pane.
The following table describes the alert information sections. The example column content is from an alert for the Malicious Sender category.
| Section | Criteria | Example |
|---|---|---|
| Verdict |
|
|
| Key Risk Indicators |
|
|
| Technical Deep Dive |
|
|
| Risk Assessment |
|
|
| Recommended Actions |
|
|
Here are more examples of the Smart Investigate tab for various attack categories.
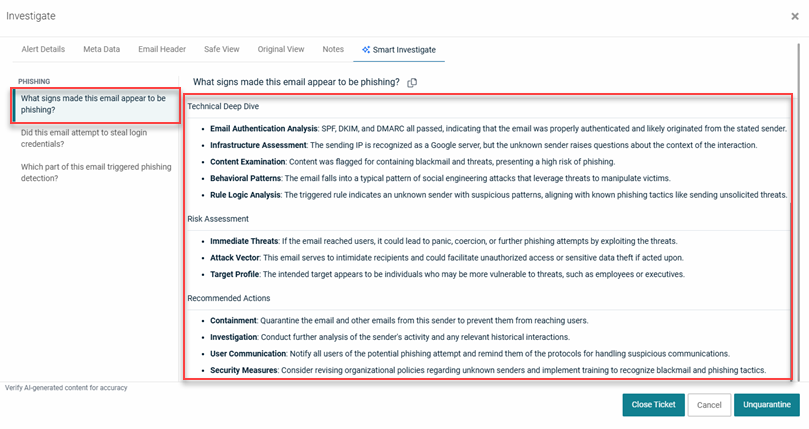
EXAMPLE This example shows the contents of the Smart Investigate tab for a Phishing threat. The alert specific information is displayed for the question "What signs made this email appear to be phishing?"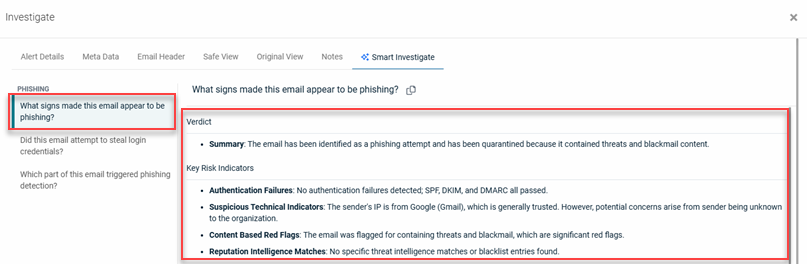
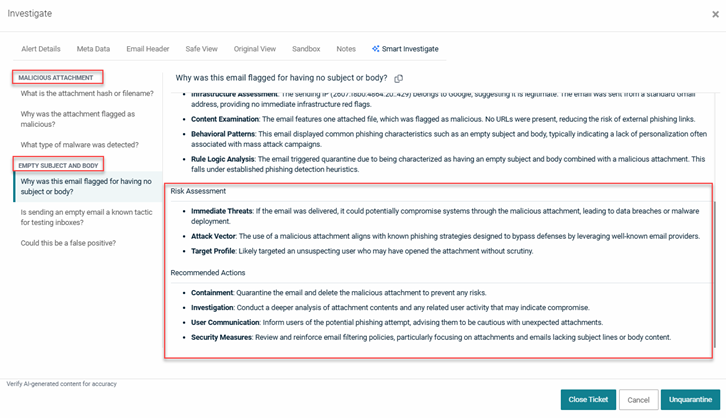
EXAMPLE This example shows the contents of the Smart Investigate tab for an alert with two attack categories: Malicious Attachment and Empty Subject and Body. The alert specific information is displayed for the question "Why was this email flagged for having no subject or body?"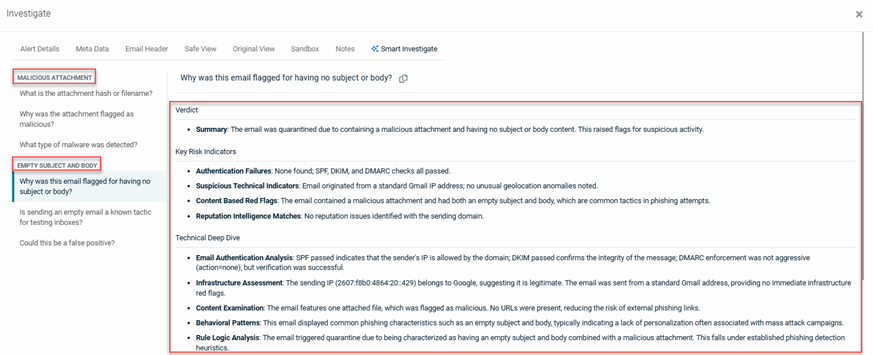
NOTE Smart Investigate functionality is also available on the Message ID page.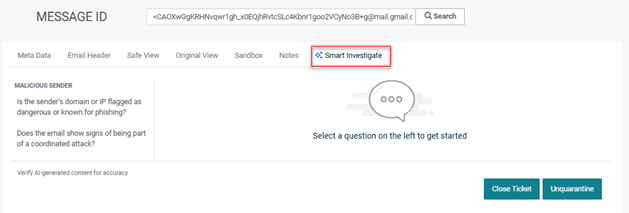
Alert tables
When Graphus takes action related to the Quarantine or EmployeeShield protection methods, it creates an alert in the applicable alert table.
- Quarantine alert table: The table includes an alert for each quarantined attack. It is important to note that Graphus creates alerts based on the attack or the sender because one attack can address multiple recipients within one email domain.
NOTE When an admin unquarantines an email, the alert will be removed from the Quarantine alert table. Therefore, you will not be able to reverse the unquarantine action because the alert entry will be gone.
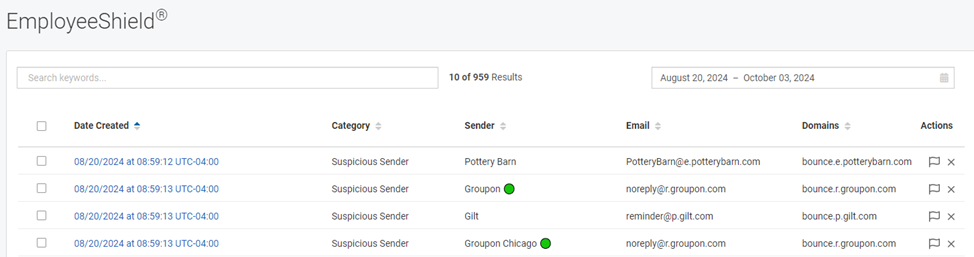
- EmployeeShield alert table: The table includes an alert for each time Graphus applied a warning banner to an email.
NOTE When a recipient clicks the Mark as Unsafe link in an EmployeeShield alert, the alert will move from the EmployeeShield alert table into the Quarantine alert table. If the admin unquarantines this alert, it will move back into the EmployeeShield alert table.
The Quarantine and EmployeeShield alert tables contain similar column data but with a few differences, as described in the table below.
| Column | Description |
|---|---|
| Date Created | Date and time for which the alert was created by Graphus. Clicking an alert link opens the alert's Investigate dialog box. |
| Category | Identifies the security related reason Graphus took action on the email. |
| Quarantined By (Quarantine table only) | Identifies the entity that quarantined the email. Values are System, Admin, or Recipient. |
| Sender Email (Quarantine table only) | Email address of the email sender. |
| Sender (EmployeeShield table only) | Name of the email sender. |
| Email (EmployeeShield table only) | Email address of the email sender. |
| Domains | Domain from which the email was sent. |
| Recipient Email (Quarantine table only) | Email address of the intended recipient. |
| Actions |
Includes icons for taking actions on the email.
|


IMPORTANT When Graphus is operating in Monitoring mode for an organization, it will analyze emails for potential threats but not take any action, meaning it will not quarantine any emails. Therefore, suspicious emails will be delivered to the intended recipients. However, an alert will be created on the EmployeeShield page for you to investigate. The purpose of Monitoring mode is to allow you to view flagged emails, mark false positives, and "quarantine" emails so the Graphus AI will learn from your actions.
For more information about operating modes, see the article Adding and activating an organization.
When an email is reported by a recipient using the Phish911 protection method, Graphus will automatically quarantine the message for all recipients who were part of the email and send a confirmation email to the reporter. In addition, Graphus will send a notification email to the IT admin as well as create an alert in the Phish911 alert table.
Phish911 alert table
The Phish911 alert table has two tabs: Reported as Phishing and Phishing Training. If Graphus determines an email is a phishing training email, the email will be listed on the Phishing Training tab. Emails that are not phishing training emails will be listed on the Reported as Phishing tab. Separating the phishing training emails allows you to focus on the reported emails that may need detailed analysis.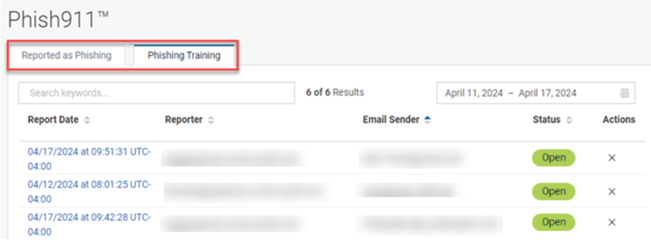
The table column data on each tab is the same, as described in the table below.
| Column | Description |
|---|---|
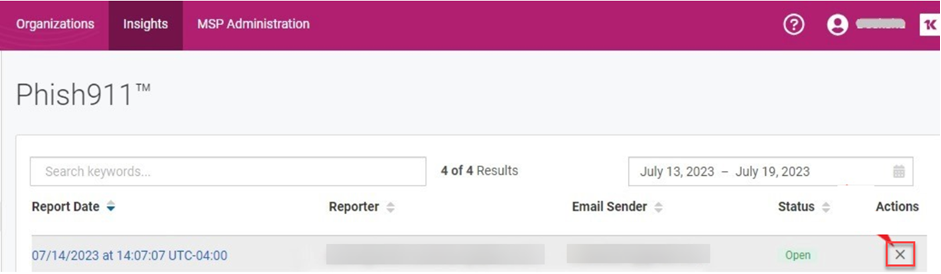
| Report Date | Date and time for which the alert was created by Graphus. Clicking an alert link opens the alert's Investigate dialog box. |
| Reporter | The recipient's email address. |
| Email Sender | Email address of the email sender. |
| Status | Possible values are Open or Closed. |
| Actions |
Close |
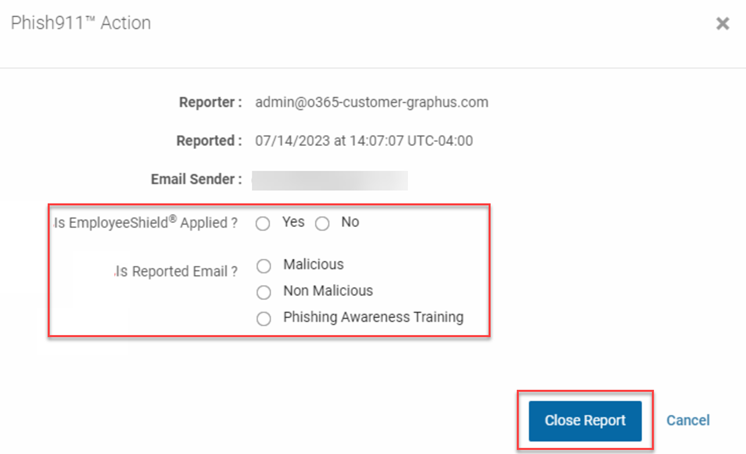
Phish911 Action dialog box
When you finish investigating a Phish911 report, you are required to complete the Phish911 Action dialog box by answering two questions:
- Is EmployeeShield Applied? Yes or No.
- Is Reported Email?Malicious, Non-Malicious, or Phishing Awareness Training.

Graphus takes action corresponding to the selections you make for these two questions, as described in the table below.
| Is EmployeeShield Applied? | Is Reported Email? | Graphus actions |
|---|---|---|
| Yes | Malicious |
|
| No | Malicious |
|
| Yes | Non-Malicious |
|
| No | Non-Malicious |
|
| Yes/No | Phishing Awareness Training |
|
How to...
- On the top navigation menu, click Organizations.
- In the Name column, click the organization for which you want to analyze quarantine alerts.
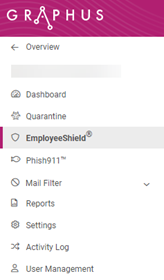
- In the left navigation menu, click Quarantine.
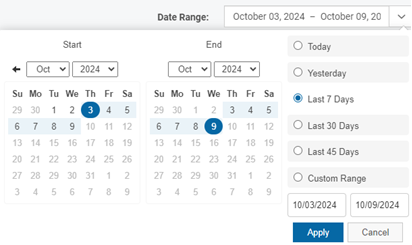
- By default, the data displayed is based on the last seven days, including the current day. If desired, in the Date Range drop-down list, select one of the options. You can select Custom Range and click Start and End dates in the calendars or enter dates in the text boxes. Then, click the Apply button.
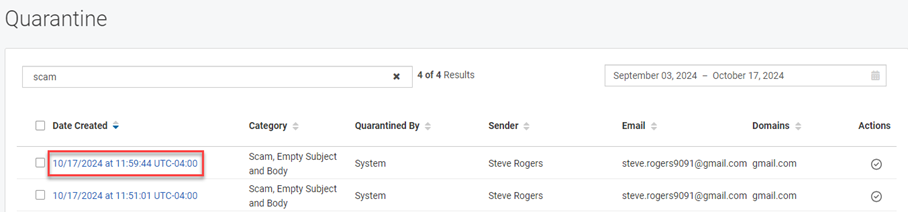
- If desired, you can filter the results by entering a value from the table into the Search field and pressing Enter.
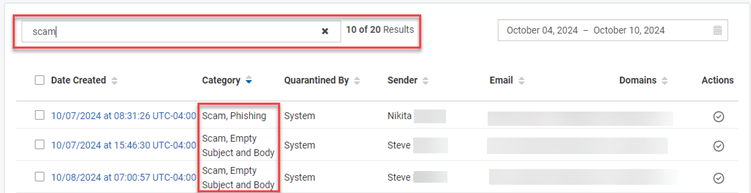
To clear the search criteria, click the X in the Search field and press Enter. - To select an alert to investigate, in the Date Created column, click the link for the desired alert.
- In the Investigate dialog box, use the tools to investigate the alert. To use the Sandbox tool, see the procedure Submit URLs or attachments via the Sandbox.
- If you determine that Graphus quarantined the email by mistake, click the Unquarantine button.
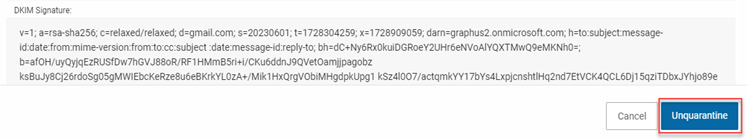
The email will be released for all of its intended recipients. The Graphus AI will automatically learn from your action and change its behavior towards the email sender.
NOTE You can unquarantine a maximum of 10 emails at once by selecting the check box for each desired email in the Quarantine table. Then, click Un-Quarantine. 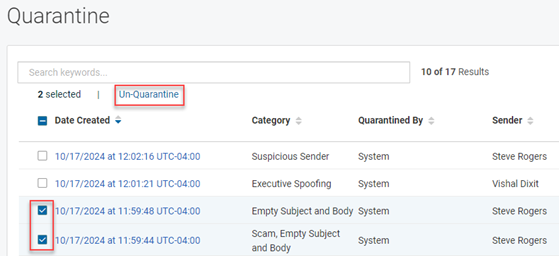
- On the top navigation menu, click Organizations.
- In the Name column, click the organization for which you want to analyze EmployeeShield alerts.
- In the left navigation menu, click EmployeeShield.
- By default, the data displayed is based on the last seven days, including the current day. If desired, in the Date Range drop-down list, select one of the options. You can select Custom Range and click Start and End dates in the calendars or enter dates in the text boxes. Then, click the Apply button.
- If desired, you can filter the results by entering a value from the table into the Search field and pressing Enter.
To clear the search criteria, click the X in the Search field and press Enter. - To select an alert to investigate, in the Date Created column, click the link for the desired alert.
- In the Investigate dialog box, use the tools to investigate the alert. To use the Sandbox tool, see the procedure Submit URLs or attachments via the Sandbox.
- Once you have finished your investigation, do one of the following:
- If you determine that Graphus applied a warning banner to this email by mistake, click the Report False Positive button. The Graphus AI will learn from this action and stop applying warning banners to emails from this sender.
- If you determine the email is malicious, click the Quarantine button. This will immediately quarantine the email from all recipients's inboxes and the alert will move from the EmployeeShield alert table to the Quarantine alert table. The Graphus AI will automatically learn from your action and change its behavior towards the email sender.
- If you determine none of the above scenarios applies to the email, click the Cancel button. In the Actions column, click the Close icon.
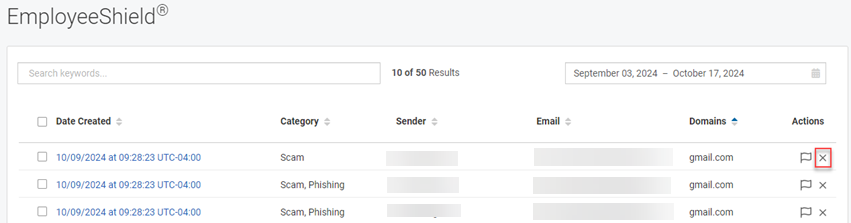
The email's check box will be disabled and the Actions field will be empty, indicating the alert has been reviewed.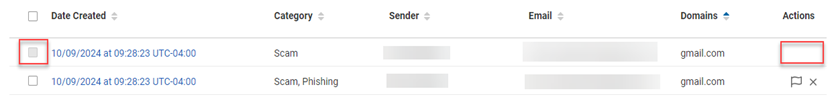
You will no longer be able to mark the email as a false-positive. However, you will still be able to quarantine the email via the Date Created link if, at some point, you determine it is malicious.
NOTE You can take action on multiple emails at once by selecting the check box for each desired email in the EmployeeShield table. Then, click Report False Positive, Quarantine, or Close Alerts.
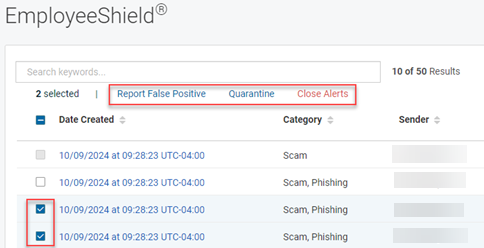
To take action on all emails at once, select the check box next to Date Created and click Report False Positive, Quarantine, or Close Alerts.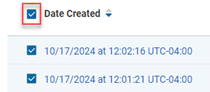
IMPORTANT When Graphus is operating in Monitoring mode for an organization, Report False Positive, Quarantine, and Close functionality are available. The Graphus AI will learn from your actions and implement the proper behavior when the mode is changed to Protection. For example, while EmployeeShield banners are not enabled in Monitoring mode, clicking the Report False Positive button will teach the Graphus AI not to include a banner on emails from this sender in the future (when in Protection mode and EmployeeShield is enabled).
You can access a Phish911 user-reported email using one of the following methods:
- Click the direct link in the email notification or the direct link in your PSA/SIEM.
- In the Graphus portal, in the Phish911 alert table or by using the Graphus organization dashboard.
NOTE The following includes the steps to access the email in the Phish911 alert table.
- In the Phish911 alert table, click the Reported as Phishing tab.
- By default, the data displayed is based on the last seven days, including the current day. If desired, in the Date Range drop-down list, select one of the options. You can select Custom Range and click Start and End dates in the calendars or enter dates in the text boxes. Then, click the Apply button.
- If desired, you can filter the results by entering a value from the table into the Search field and pressing Enter.
To clear the search criteria, click the X in the Search field and press Enter. - To select an alert to investigate, in the Report Date column, click the link for the desired report.
- In the Investigate dialog box, use the tools to investigate the alert.
- On the Original View tab, check if the email has a Graphus warning banner. You will need this information to close the report. To use the Sandbox tool, see the procedure Submit URLs or attachments via the Sandbox.
- After you are done with your investigation, close the Investigate dialog box.
- In the Phish911 table, in the Actions column, click the Close Report icon.
- In the Phish911 Action dialog box, complete the following:
- Is EmployeeShield Applied? Select Yes or No.
- Is Reported Email? Select Malicious, Non Malicious, or Phishing Awareness Training.
- Click the Close Report button.
Graphus will take action based on the selections you made in the Phish911 Action dialog box.
IMPORTANT It is required that you click the Close Report button to close the alert. The reporter will only receive the final investigation results if the alert is closed. Also, closing the alert helps Graphus AI learning based on your selections in the Phish911 Action dialog box.
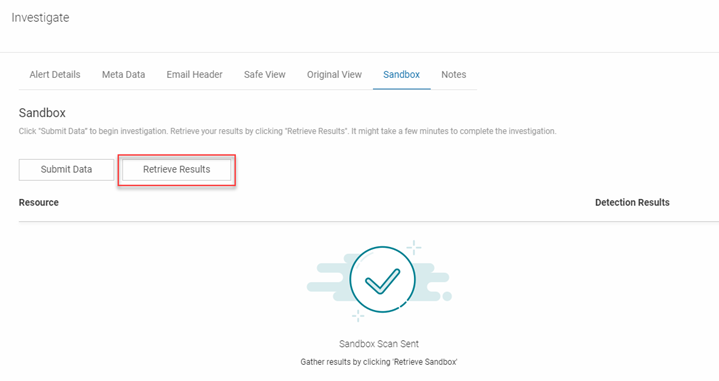
- In the Investigate dialog box, click the Sandbox tab.
- Click the Submit Data button.
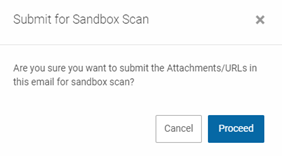
- In the confirmation dialog box, click the Proceed button.
A message displays stating the sandbox scan was sent.
- Click the Retrieve Results button. The processing of the submitted files might take a few minutes. If you don't see any results after waiting a minute or so, click the Retrieve Results button again.
- In the confirmation dialog box, click the Proceed button.

- In the Resource table, expand the resource item.
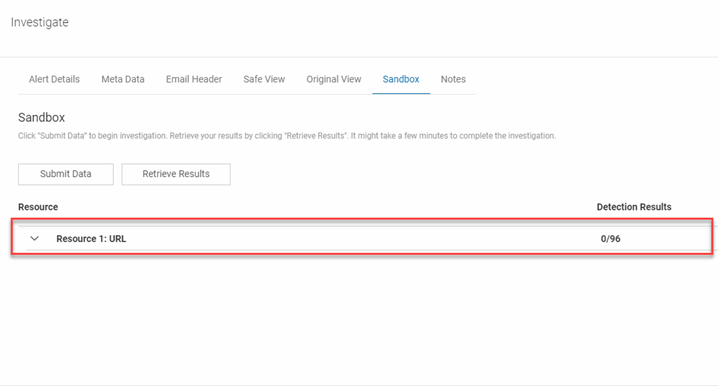
- The results are displayed. For a description of each result, see the Detection results section below.
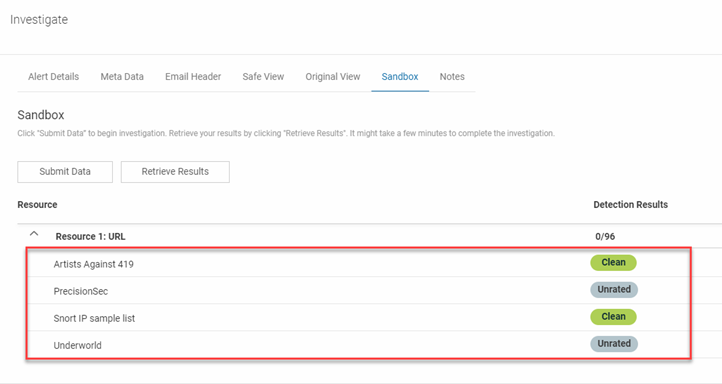
The following table describes the detection results for URLs and attachments submitted to the Sandbox.
| Type | Result | Description |
|---|---|---|
| URL | Clean site | No malware was detected. |
| Unrated site | The partner never reviewed the given site. | |
| Malware site | The site distributes malware. | |
| Phishing site | The site tries to steal users' credentials. | |
| Malicious site | The site contains exploits or other malicious artifacts. | |
| Suspicious site | The partner thinks this site is suspicious but not malicious. | |
| Spam site | The site is involved in unsolicited email, popups, automatic commenting, etc. | |
| File | Undetected | The given engine does not detect the file as malicious. |
| Suspicious | The given engine flags the file as suspicious. | |
| Unable to process file type | The given engine does not understand the type of file submitted and so will not produce verdicts for it. | |
| Timeout | The given engine reached time execution limit when processing the file and so no verdicts were recorded for it. |


