Activating and branding phishing defense reports
This article describes the phishing reports available in Graphus and how you can customize them for each organization.
Report types
Graphus provides two options for generating phishing defense reports: daily and monthly.
Both include the same categories of information. The daily report contains data from the previous day while the monthly report consists of all the data from the previous month. Both reports are generated as HTML files that are emailed to your designated recipients. The monthly report is sent on the first of every month.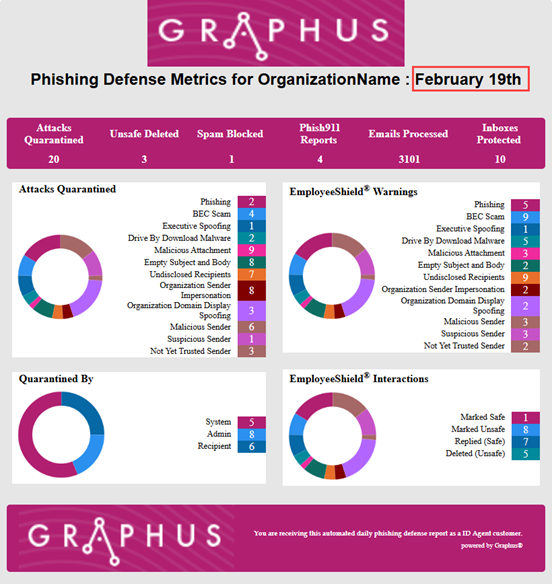
In addition, the monthly report can be generated as a downloadable PDF. The phishing information in the PDF report is presented a bit differently than in the HTML version.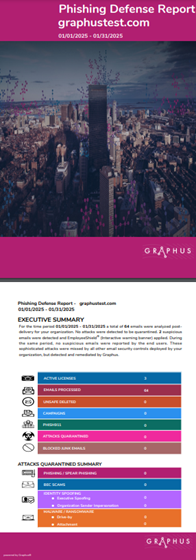
Each version is described below.
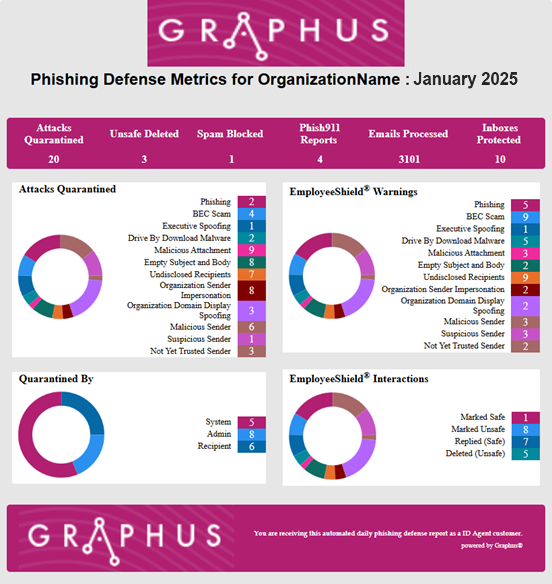
HTML version
Report heading
- Attacks quarantined: Conveys the number of quarantined attacks.
- Unsafe Deleted: Shows the number of emails with a warning banner that were deleted by recipients.
- Spam Blocked: Shows the number of emails blocked by the personal mail filters and the organization spam filter.
- Phish911 Reports: Indicates the number of Phish911 reports submitted by recipients.
- Emails Processed: Conveys the number of emails scanned by Graphus.
- Inboxes Protected: Indicates the number of inboxes that are protected by Graphus.
Report sections
Each card is described below.
- Attacks Quarantined: Conveys the total number of emails quarantined as well as the number quarantined for each category. One attack can apply to more than one category, increasing the total number indicated in the donut chart.
- Quarantined By: Shows the total number of phishing emails quarantined and the number quarantined by the System, Admin, and Recipient via the banner.
- EmployeeShield Warnings: Conveys the total number of category emails in which Graphus inserted a warning banner as well as the number of warning banners inserted for each category. The same email can apply to more than one category, increasing the total number indicated in the donut chart.
- EmployeeShield Interactions: Shows the total number of EmployeeShield Interactions and the number of actions taken on the banner or emails with a banner. Marked Safe and Marked Unsafe are emails with a banner where a recipient marked the sender as safe or unsafe. Replied (Safe) and Deleted (Unsafe) shows you if a recipient replied to or deleted an email with a warning banner.
PDF version
The monthly phishing defense report can be downloaded as a PDF. The PDF includes a cover page with the organization name and dates displayed in the header.
The second page starts with an Executive Summary section that captures the key information in the tables that follow. The tables convey the following information:
- Active licenses: The number of inboxes that are protected by Graphus.
- Emails processed: The number of emails that were analyzed after they were delivered to your organization.
- Unsafe deleted: The number of emails with a warning banner that were deleted by recipients.
- Campaigns: The number of multiple emails from the same sender that are detected and quarantined by Graphus.
- Phish911: The number of Phish911 reports submitted by recipients.
- Attacks quarantined: The number of emails quarantined.
- Blocked junk emails: The number of emails blocked by the personal mail filters and the organization spam filter
A breakdown of the specific attack categories is conveyed in the Attacks Quarantined Summary table.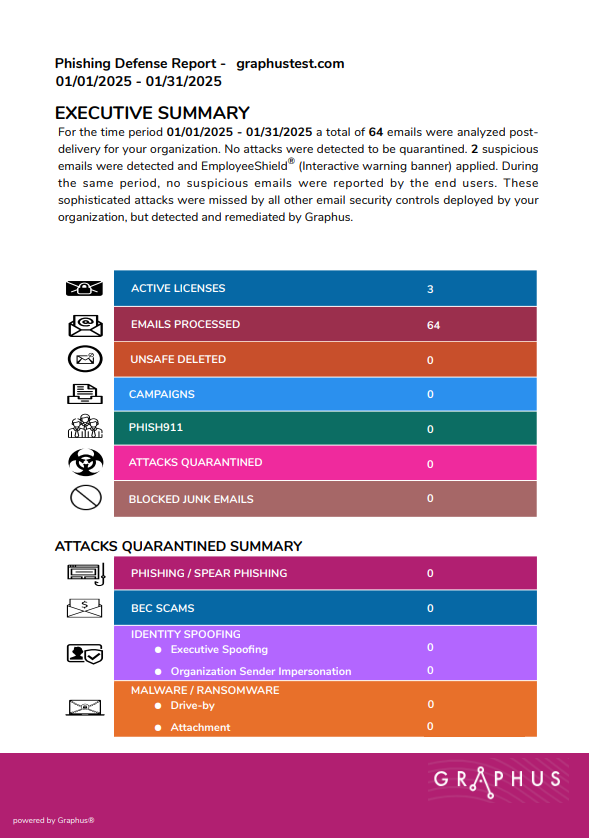
Reports branding
You can customize your reports by adding your company logo and selecting a color for the header and footer. The modifications you make apply to your email and downloadable reports, which are available from the Dashboard and Reports page.
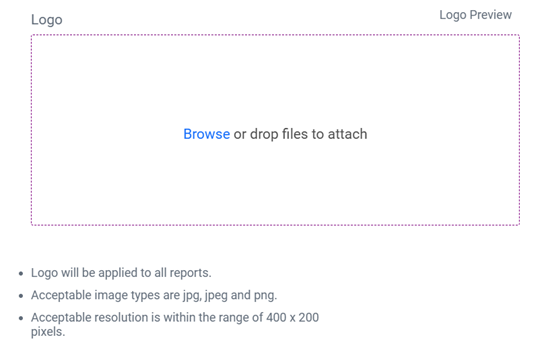
Logo
Add your company logo to your reports by browsing to or dropping the desired file in the Logo field. The acceptable image file types are JPG, JPEG, PNG, and GIF. The acceptable image resolution is within 400 x 200 pixels. As soon you upload the logo, you can preview the logo on the right side. 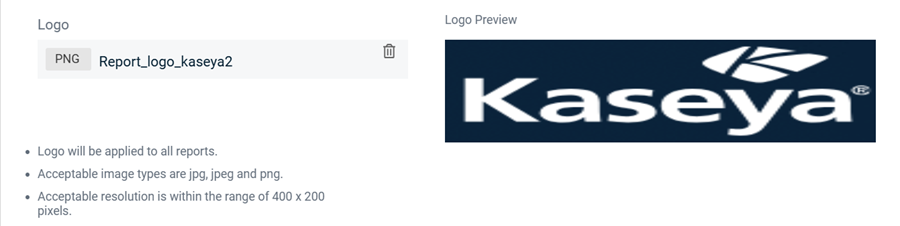
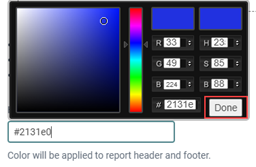
Header and Footer Color
Click inside the text box to display the color palette. Select a color by dragging the dot inside the square to a specific location. Also, you can drag the slider bar up or down to move between hues of different colors. Alternatively, you can manually enter the color code. 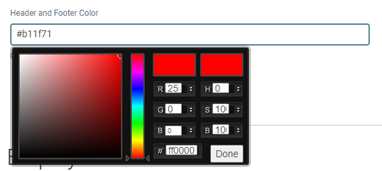
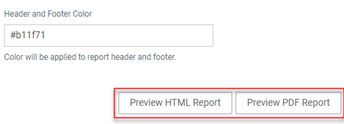
Previewing Reports
Previewing a report shows how the report will look to your customers when they receive it.
The Preview HTML Report button displays the report in HTML format.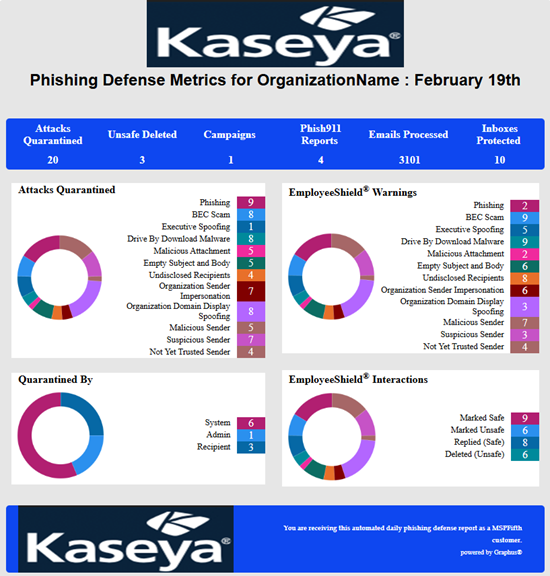
The Preview PDF Report button displays the report in PDF format. 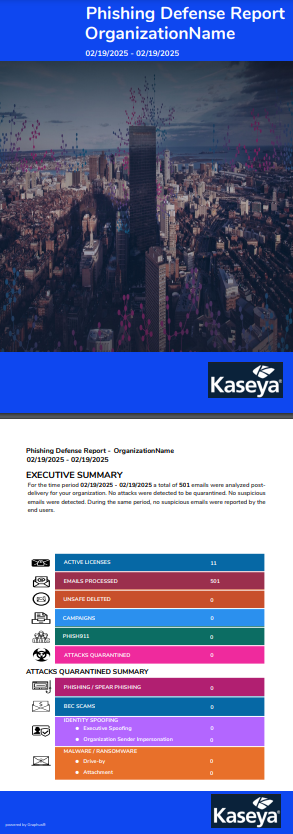
How to...
Activate reports and apply report branding at the organization level
To start, log in as an admin and select the desired organization.
- In the navigation pane, select Settings > General Settings.
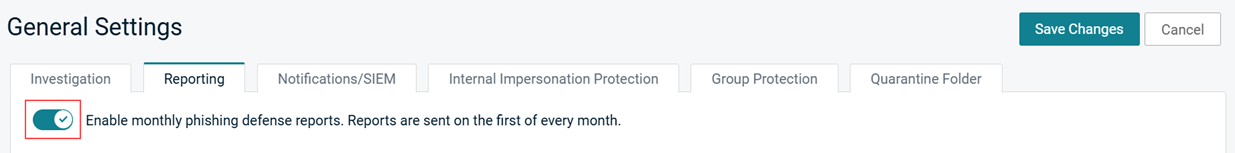
- On the General Settings page, click the Reporting tab.
- To enable monthly phishing defense reports, click the toggle.
- In the Recipient Email Addresses field, enter the address of the recipient and press Enter.
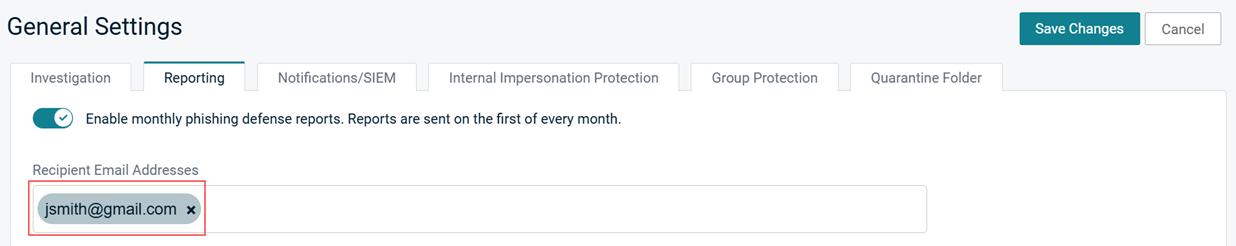
- Continue to add the necessary recipient addresses, pressing Enter after each one.
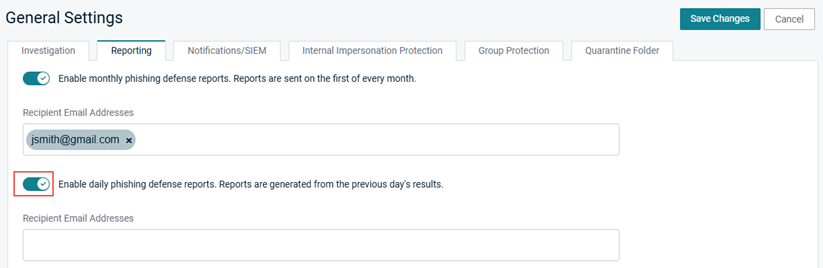
- To enable daily phishing defense reports, click the toggle and add the necessary recipient addresses.
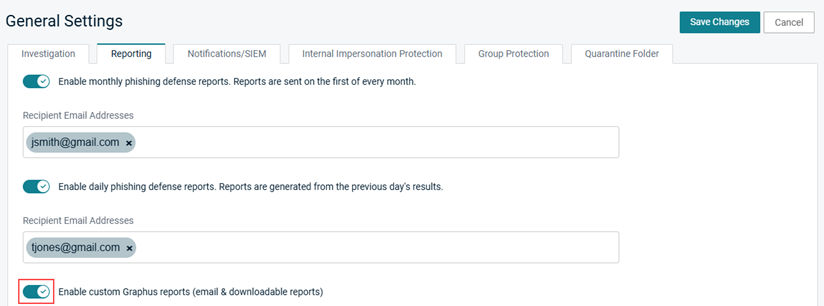
- To customize your reports:
- Click the Enable custom graphus reports toggle.
- Add your company logo by browsing to or dropping the desired file in the Logo field. The acceptable image file types are JPG, JPEG, PNG, and GIF. The acceptable image resolution is within 400 x 200 pixels.
As soon as you upload the logo, it is displayed for preview. - To select a color for the report header and footer:
- Click inside the Header and Footer Color text box to display the color palette.
- Select a color by dragging the dot inside the square to a specific location. Also, you can drag the slider bar up or down to move between hues of different colors. Alternatively, you can manually enter the color code.
- Click Done.
- Click the Enable custom graphus reports toggle.
- Click the Preview HTML Report button or the Preview PDF Report button.
- In the upper-right corner, click Save Changes.


