Application overview
This article provides an overview of the Graphus user interface.
Graphus functionality is accessed using the three tabs on the top menu.
Organizations
The Organizations page displays subscription information and organization specific data, such as the Organization Type, number of Active Licenses, and the Status, for all protected email domains. Also, you can perform organization actions like disabling it or editing its information.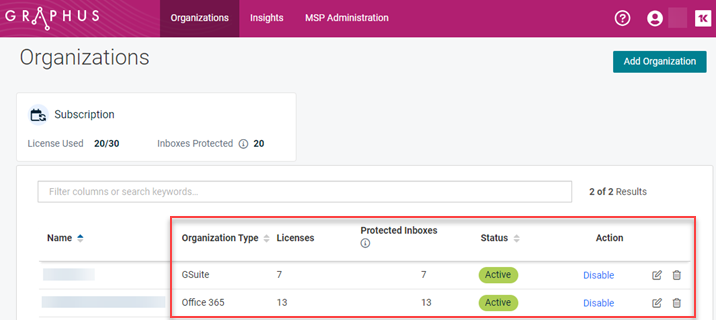
Insights
Clicking the Insights tab on the top menu navigates to the partner dashboard. The dashboard displays a brief summary of the threat information for all of your active organizations.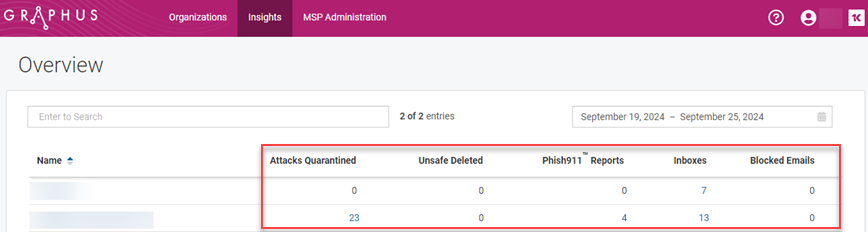
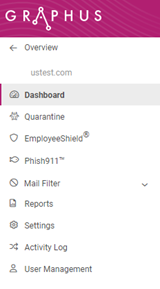
Selecting an organization on the partner dashboard opens the dedicated organization page. The organization dashboard provides access to threat information specific to the organization. You can set options via the left navigation menu.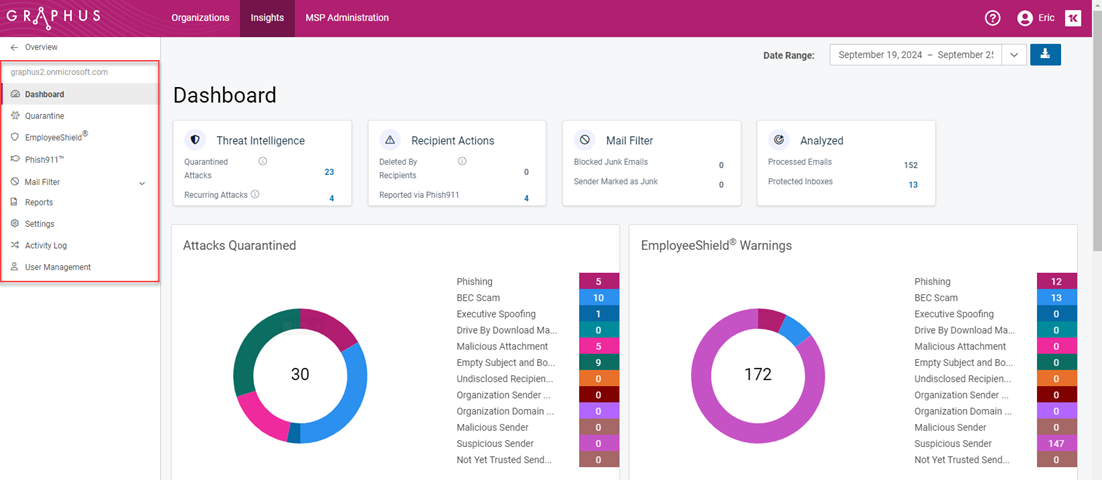
The following table includes a description of each page accessed from the navigation menu.
| Navigation menu | Page | Description |
|---|---|---|
|
Dashboard | Displays threat information specific to the organization. |
| Quarantine | Lists the emails which Graphus has determined to be malicious and therefore, removed from the user's inbox. Admins can investigate an email and unquarantine it if warranted. | |
| EmployeeShield | When the EmployeeShield Banner is enabled, the EmployeeShield page lists the emails which users have reported as being unsafe. Admins can investigate an email and quarantine it or mark it as safe (report false positive). | |
| Phish911 |
When the Phish911 feature is enabled, the Phish911 page lists emails that weren’t quarantined or bannered by Graphus but were reported by users as being suspicious. Admins can investigate an email and keep the email quarantined, unquarantine it, or mark it as a phishing awareness training email. |
|
| Mail Filter | Graphus provides options for blocking spam at the recipient and organization levels. Admins can manage blocked spam emails using the Mail Filter tools. | |
| Reports | Monthly phishing defense reports can be viewed/downloaded. | |
| Settings | Includes application settings that apply to the selected organization only. These settings override those made at the global level. | |
| Activity Log | Lists the actions of your organization users. | |
| User Management | Lists your organization users and allows you to add new users. Users added to a specific organization have access to that organization only. |
NOTE For detailed information about a specific page, access the applicable article from the table of contents.
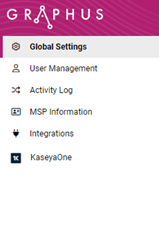
MSP Administration
On the MSP Administration page, you can manage global settings, integrations with other products, and KaseyaOne Unified Login.
IMPORTANT The MSP Administration page is only available for users with the MSP admin role.
The following table includes a description of each page accessed from the MSP Administration navigation menu.
| Navigation menu | Page | Description |
|---|---|---|
|
Global Settings | Allows you to configure default settings for all future organizations that you add as well as apply settings to existing organizations simultaneously. |
| User Management | Lists your organization users and allows you to add new users. Users added at the MSP level have global access to all the MSP’s organizations in Graphus. | |
| Activity Log | Lists the actions of your global users. | |
| MSP Information |
Displays admin information and the number of licenses available, consumed out of the total purchased. |
|
| Integrations | Enables you to integrate Graphus with other Kaseya products to enhance Graphus functionality. | |
| KaseyaOne | You can enable KaseyaOne settings that make accessing Graphus and user management easier. |
NOTE For detailed information about a specific page, access the applicable article from the table of contents.


